November 04, 2025
Introduction
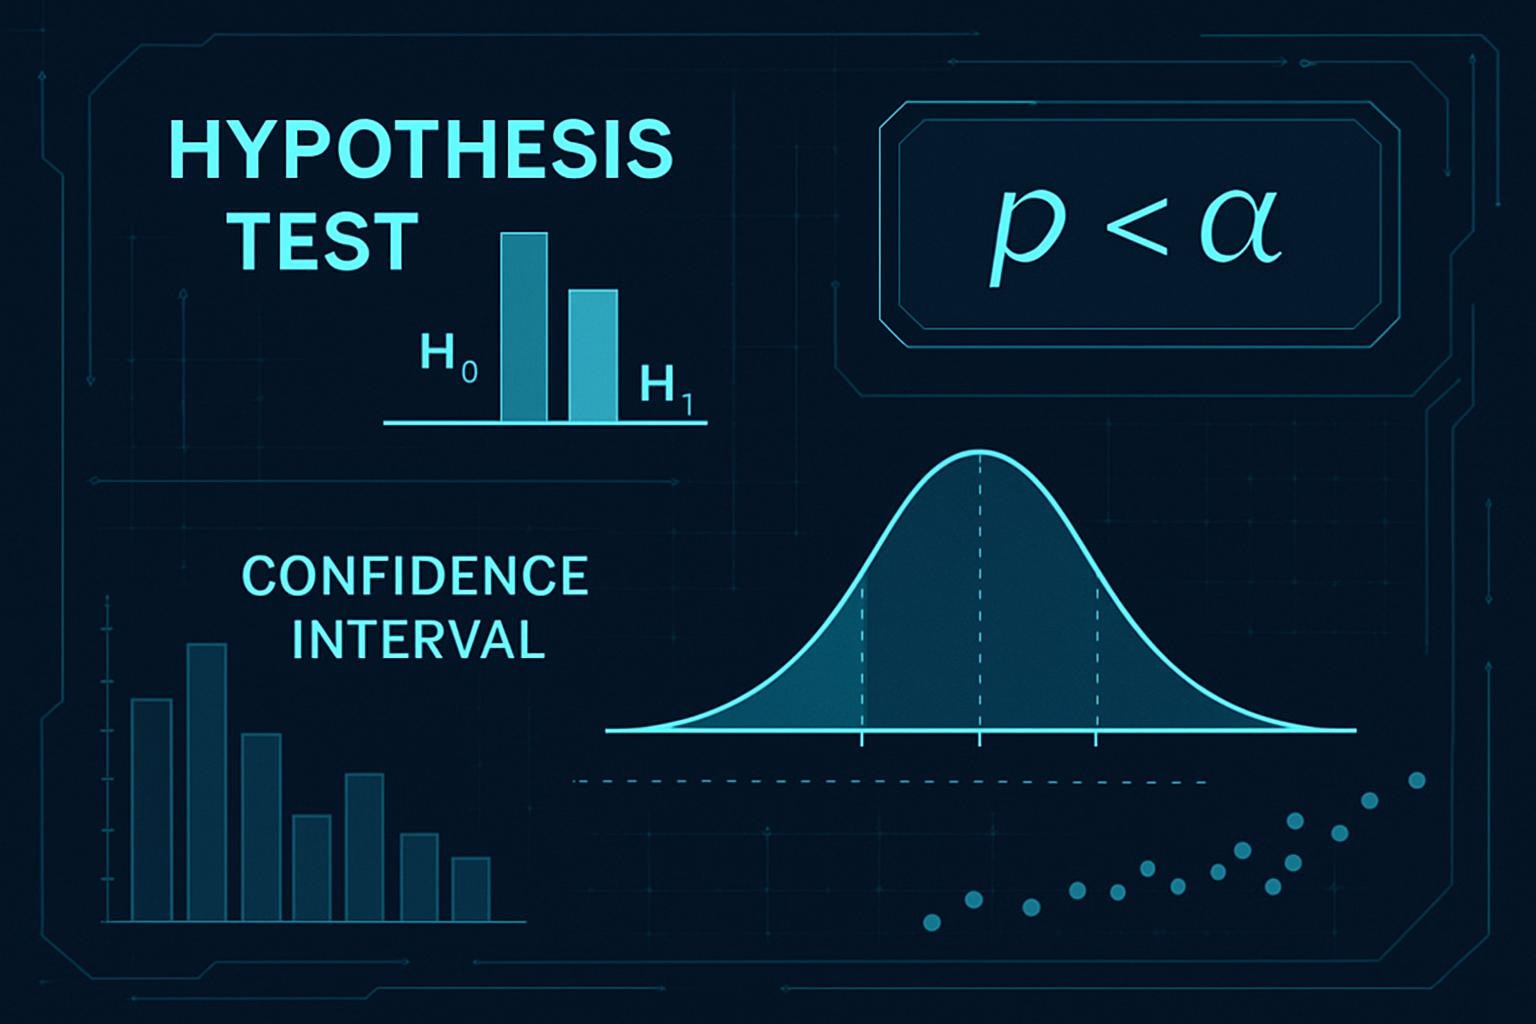
Hypothesis tests and confidence intervals are two of the most powerful tools in a data scientist’s inferential statistics toolkit. They allow us to draw conclusions about a larger population from a smaller sample of data — a crucial step in turning limited observations into meaningful insights.
A hypothesis test helps determine whether a difference or relationship we observe in the data is truly significant or simply due to chance. A confidence interval, on the other hand, goes one step further by providing a range of plausible values for the true population parameter, giving us a clearer sense of the measure’s reliability.
Together, these techniques ensure that our conclusions are grounded in statistical evidence rather than assumption — helping decision-makers act with confidence based on the data at hand.
Inferential Statistics
When working with data, we often don’t have access to all possible data points that exist in the world. Instead, we rely on a subset of that data — a sample that represents the larger population.
Inferential statistics refers to the methods that allow us to make educated judgments about that bigger picture using probability as our guide.
In inferential statistics, we typically define a confidence level (for example, 95%) or a significance level (commonly 0.05). These levels determine how confident we can be in our results and help us understand the likelihood that our conclusions are correct.
Hypothesis Tests
A hypothesis test helps us evaluate whether a difference or relationship we see in our data occurred by random chance or represents a statistically meaningful effect.
Steps to Perform a Hypothesis Test
- State the hypotheses
- Null hypothesis (H₀): Assumes no effect or difference.
- Alternative hypothesis (H₁): Suggests that an effect or difference exists.
- Choose a significance level (α)
- This value determines how much risk we’re willing to accept of incorrectly rejecting the null hypothesis when it’s actually true.
- Calculate the p-value
- The p-value represents the probability that the observed data would occur if the null hypothesis were true.
- Make a decision
- If p-value < α, we reject the null hypothesis — meaning the result is statistically significant.
- If p-value ≥ α, we fail to reject the null hypothesis — meaning there isn’t enough evidence to claim a difference exists.
(Example: A company tests whether a new marketing campaign increases average weekly sales. If the p-value is below 0.05, the data suggests the campaign likely had a real effect.)
Confidence Intervals
After running a hypothesis test, we often want to understand the range of values within which the true population measure might fall. That’s where confidence intervals come in.
A confidence interval gives us a range of plausible values for an unknown population parameter — such as a mean, proportion, or difference — along with a level of confidence (often 95%).
Steps to Create a Confidence Interval
- Identify a sample statistic
- This could be a mean, proportion, or difference between groups.
- Choose a confidence level
- The confidence level defines the proportion of times the true parameter would fall within the interval if we repeated the sampling many times.
- Calculate the margin of error
- This represents the uncertainty associated with the estimate.
- Compute the confidence interval
- Combine the sample statistic with the margin of error to create the range.
While these calculations can be done manually, most professionals rely on software to compute them efficiently and accurately. I personally recommend using a programming tool like Python or R (I prefer R for statistical analysis), as they allow you to manipulate data flexibly and run hypothesis tests and confidence intervals with just a few lines of code.
Closing Thoughts
Hypothesis tests and confidence intervals work hand-in-hand to transform data into insight. Hypothesis tests help us decide whether an observed effect is significant, while confidence intervals quantify the uncertainty around that effect.
Together, they form the foundation of evidence-based decision-making — allowing analysts and business leaders alike to make choices backed by statistical confidence rather than intuition.