A/B testing loan policies to optimise risk and business performance.
This project evaluates how different lending strategies impact default risk and profitability. By comparing a conservative and a growth-oriented policy, the analysis highlights the trade-off between reducing credit losses and scaling loan approvals using statistical testing.

1.
Business Problem — What Was the Challenge?
A lending company wanted to evaluate alternative loan approval policies to better manage credit risk, while still maintaining profitability.
The core challenge was clear:
How can we reduce the number of defaulting loans without limiting business growth?
2.
Approach & Method — How It Was Solved
To address this, we first defined a clear evaluation metric:
Default rate among approved loans
(P(loan_is_bad = 1 | approved = 1))
This metric directly captures the company’s risk exposure, as losses only occur when a loan is both approved and subsequently defaults.
We then designed two alternative loan policies:
- Policy A (Conservative)
Stricter approval criteria → focuses on higher-quality borrowers - Policy B (Growth-Oriented)
More lenient criteria → increases loan approvals and market reach
Each policy was defined using key credit risk variables such as:
- loan grade
- debt-to-income ratio (DTI)
- annual income
Based on these thresholds, we determined which applicants would be approved under each policy.
To compare the two approaches, we conducted an A/B test, using a:
Two-proportion z-test
This allowed us to test whether Policy B leads to a significantly higher default rate compared to Policy A.
3.
Results & Business Insights
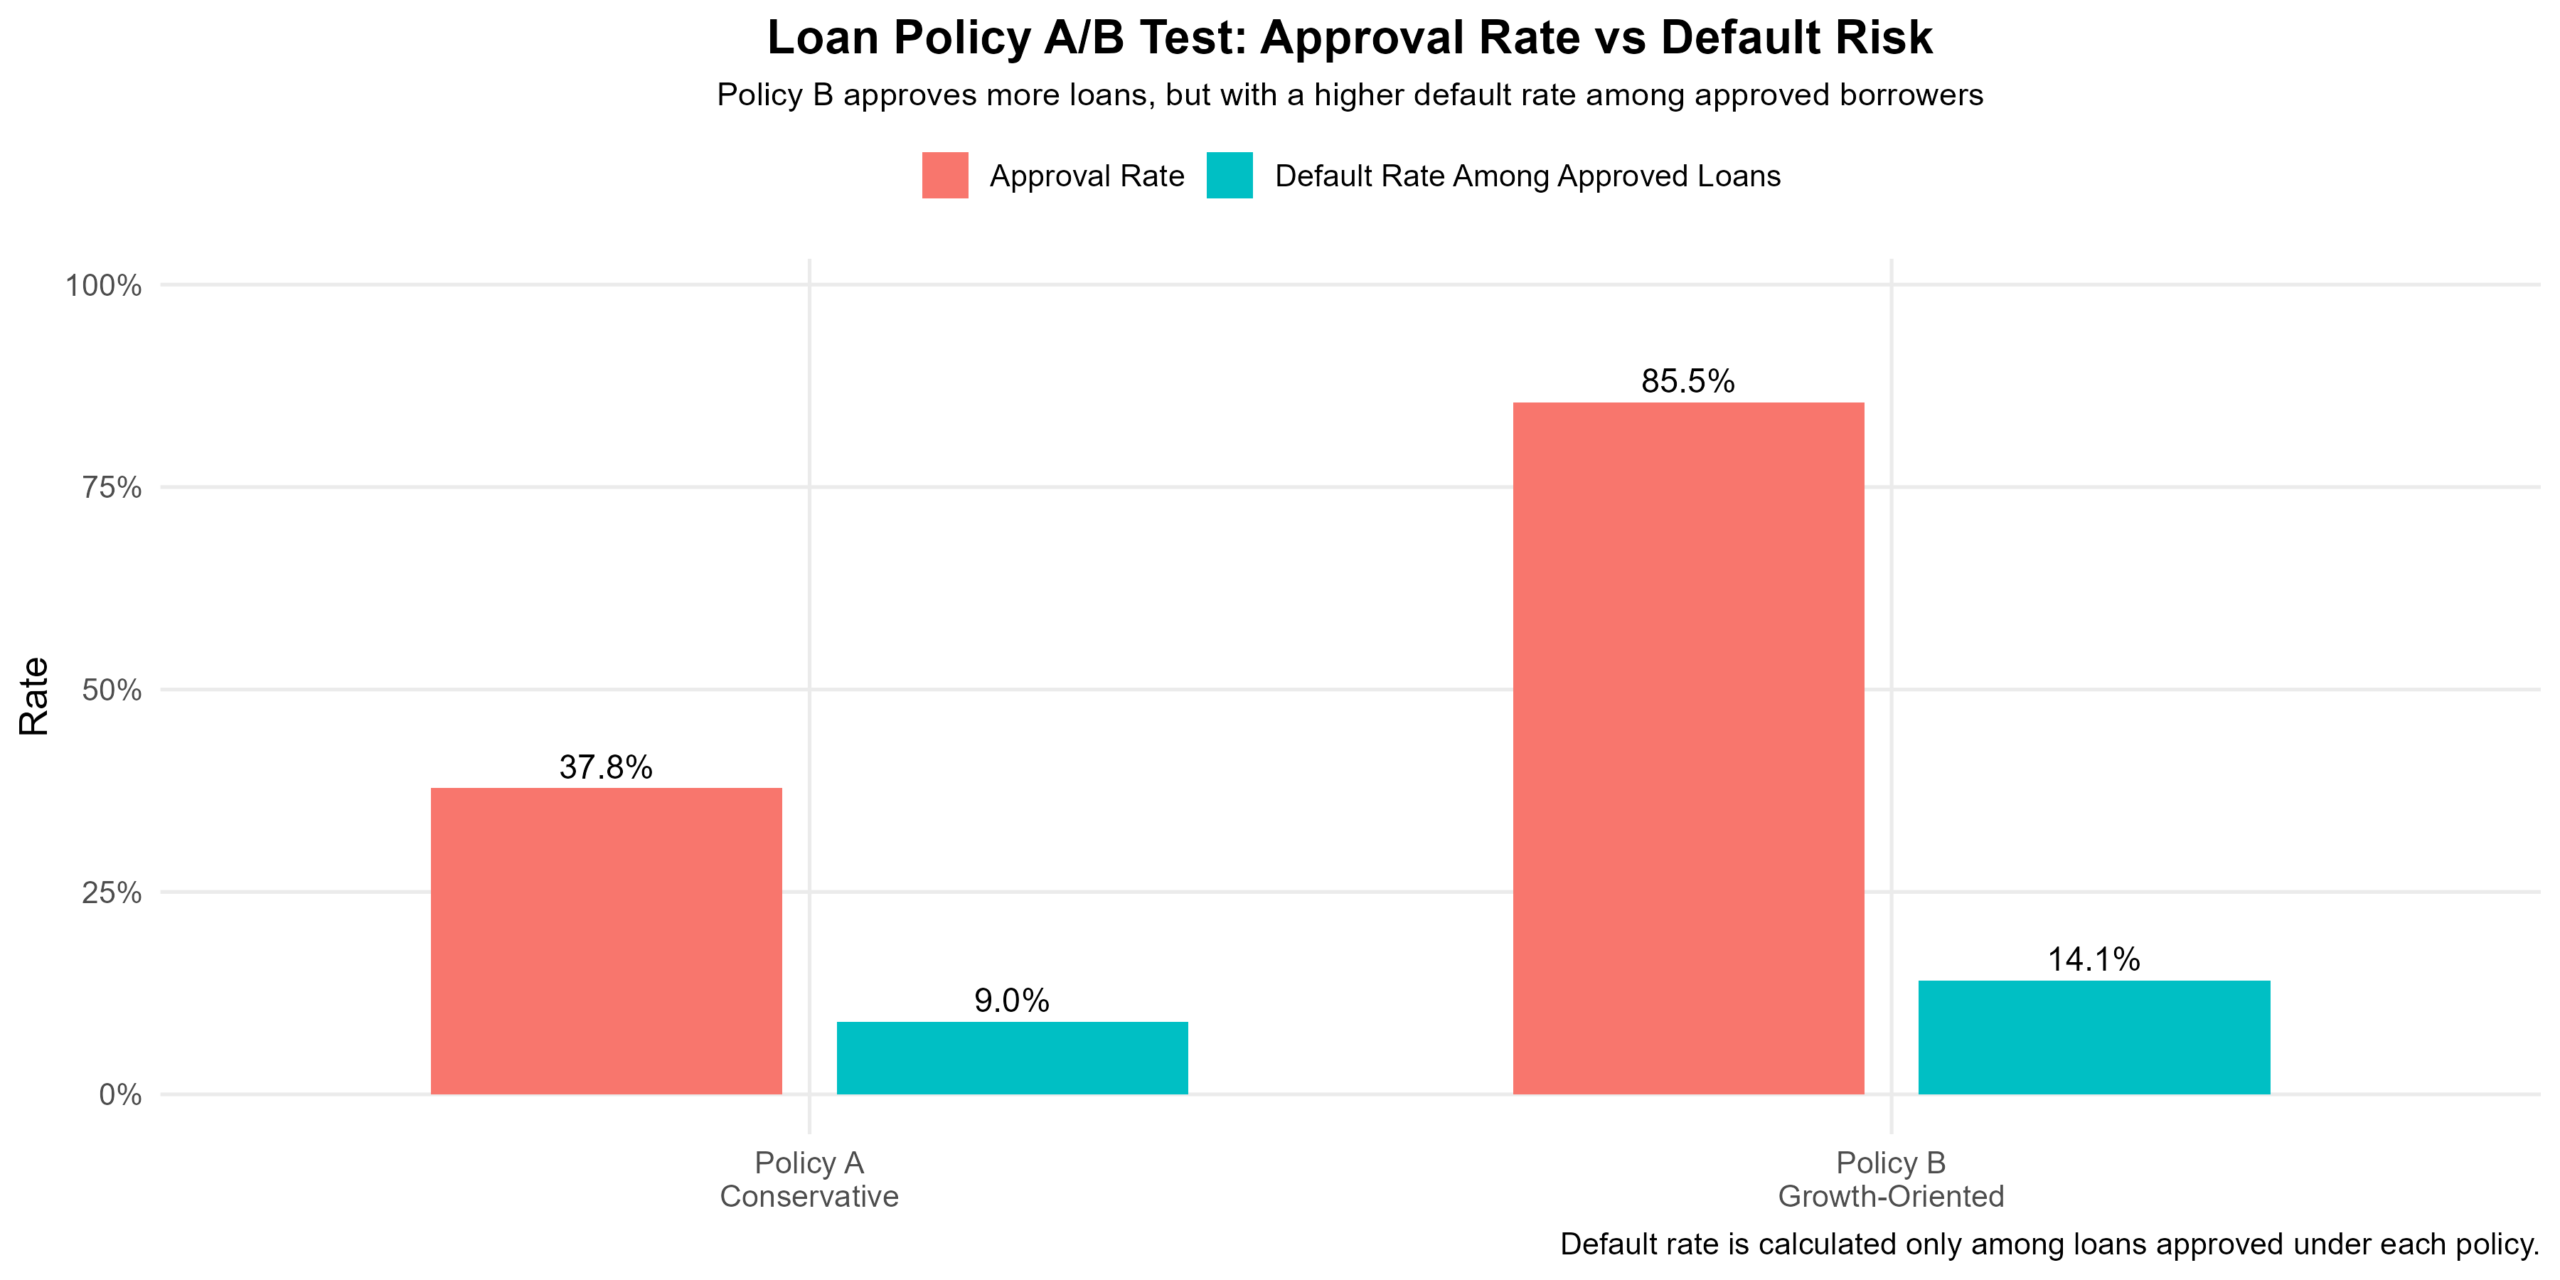
Policy B increases approvals significantly, but at the cost of a higher default rate among approved loans.
We tested the following hypotheses:
H₁: Policy B has a higher default rate than Policy A
H₀: No difference in default rates between Policy A and Policy B
Results:
- z = 17.65
- p < 0.001
The result is highly significant, meaning:
Policy B approves a significantly higher proportion of loans that default compared to Policy A.
What does this mean in practice?
- Default rate difference: +5.10 percentage points
- Equivalent to:
~51 additional defaults per 1,000 approved loans
Since each default represents a direct financial loss, this increase translates into substantially higher credit risk exposure.
Key Insight
- Policy A → Strong risk control
- Policy B → Higher growth, but higher risk
From a risk mitigation perspective, Policy A clearly outperforms.
4.
Business Implications and Limitations
While Policy A reduces default risk, it comes with an important trade-off:
Fewer approved loans → potentially lower revenue
This highlights a key limitation of the analysis:
- The evaluation focuses on risk (defaults)
- It does not directly account for profitability
To fully align with business objectives, we need to extend the analysis to include:
- Net Present Value (NPV)
- or profit per approved loan
This would allow decision-makers to evaluate:
The trade-off between risk reduction and business growth
Final Takeaway
There is no universally “best” policy — only a best policy given the company’s risk appetite.
- If the priority is minimising losses → Policy A
- If the priority is maximising growth and scale → Policy B
The optimal strategy likely lies in balancing both.
5.
Resources
Below you can find a PDF of the analysis that was done for the project using R.